Note
MODFLOW-USG Freyberg demo
This example demonstrates a MODFLOW USG Freyberg model, including construction of an UnstructuredGrid from a specification file and plotting head data in cross-section.
First we locate the model directory.
[1]:
from pathlib import Path
import flopy

root_name = "freyberg.usg"
model_ws = Path.cwd().parent / "../examples/data" / root_name.replace(".", "_")
Now construct an UnstructuredGrid from a grid specification file.
[2]:
from flopy.discretization import UnstructuredGrid

mfgrid = UnstructuredGrid.from_gridspec(str(model_ws / f"{root_name}.gsf"))
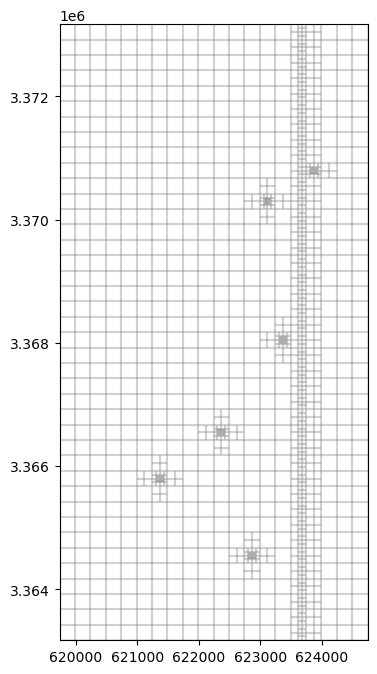
Plot the grid in map view.
[3]:
import matplotlib.pyplot as plt

fig = plt.figure(figsize=(8, 8))
ax = fig.add_subplot(1, 1, 1, aspect="equal")
pmv = flopy.plot.PlotMapView(modelgrid=mfgrid, ax=ax)
pmv.plot_grid(alpha=0.1)
[3]:
<matplotlib.collections.LineCollection at 0x7f98fb62e7d0>
Create cross-section lines.
[4]:
from flopy.utils.geometry import LineString

lines = [
    LineString(ls)
    for ls in [
        [(623000, 3364000), (623000, 3372000)],
        [(623650, 3364000), (623650, 3372000)],
    ]
]
Load the model and retrieve inactive cells.
[5]:
gwf = flopy.mfusg.MfUsg.load(
    f"{root_name}.nam",
    model_ws=str(model_ws),
    verbose=False,
    check=False,
    exe_name="mfusg",
)

bas6 = gwf.get_package("bas6")
ibound = bas6.ibound.array
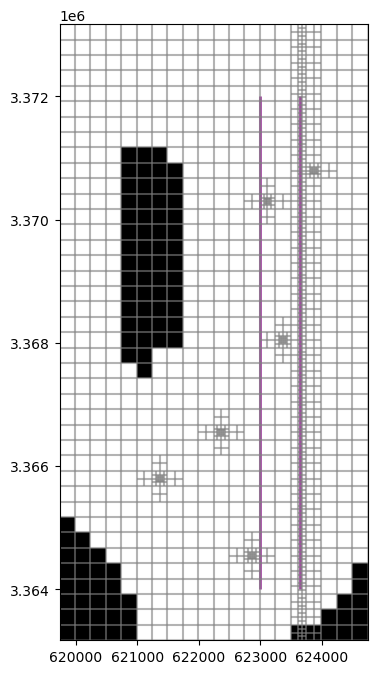
Show the map view again with cross-section lines and inactive cells.
[6]:
fig = plt.figure(figsize=(8, 8))
ax = fig.add_subplot(1, 1, 1, aspect="equal")
pmv = flopy.plot.PlotMapView(modelgrid=mfgrid, ax=ax)
grid = pmv.plot_grid(alpha=0.2)
shps = pmv.plot_shapes(lines, edgecolor="purple", lw=2, alpha=0.7)
inac = pmv.plot_inactive(ibound=ibound)
Next, we can run the model and plot cross-sections of the resulting head. We will run the model in a temporary workspace to avoid altering the example data.
[7]:
from tempfile import TemporaryDirectory

# temporary directory
temp_dir = TemporaryDirectory()
work_dir = Path(temp_dir.name) / "freyberg_usg"

gwf.change_model_ws(str(work_dir))
gwf.write_name_file()
gwf.write_input()
success, buff = gwf.run_model(silent=True, report=True)
if success:
    for line in buff:
        print(line)
else:
    raise ValueError("Failed to run.")
creating model workspace...
   ../../../../../../../tmp/tmpc4u3riio/freyberg_usg

                                  MODFLOW-USG
    U.S. GEOLOGICAL SURVEY MODULAR FINITE-DIFFERENCE GROUNDWATER FLOW MODEL
                             Version 1.5.00 02/27/2019

 Using NAME file: freyberg.usg.nam
 Run start date and time (yyyy/mm/dd hh:mm:ss): 2023/05/04 16:05:11

 Solving:  Stress period:     1    Time step:     1    Groundwater Flow Eqn.
 Solving:  Stress period:     2    Time step:     1    Groundwater Flow Eqn.
 Solving:  Stress period:     3    Time step:     1    Groundwater Flow Eqn.
 Solving:  Stress period:     4    Time step:     1    Groundwater Flow Eqn.
 Solving:  Stress period:     5    Time step:     1    Groundwater Flow Eqn.
 Solving:  Stress period:     6    Time step:     1    Groundwater Flow Eqn.
 Solving:  Stress period:     7    Time step:     1    Groundwater Flow Eqn.
 Solving:  Stress period:     8    Time step:     1    Groundwater Flow Eqn.
 Solving:  Stress period:     9    Time step:     1    Groundwater Flow Eqn.
 Solving:  Stress period:    10    Time step:     1    Groundwater Flow Eqn.
 Solving:  Stress period:    11    Time step:     1    Groundwater Flow Eqn.
 Solving:  Stress period:    12    Time step:     1    Groundwater Flow Eqn.
 Solving:  Stress period:    13    Time step:     1    Groundwater Flow Eqn.
 Solving:  Stress period:    14    Time step:     1    Groundwater Flow Eqn.
 Solving:  Stress period:    15    Time step:     1    Groundwater Flow Eqn.
 Solving:  Stress period:    16    Time step:     1    Groundwater Flow Eqn.
 Solving:  Stress period:    17    Time step:     1    Groundwater Flow Eqn.
 Solving:  Stress period:    18    Time step:     1    Groundwater Flow Eqn.
 Solving:  Stress period:    19    Time step:     1    Groundwater Flow Eqn.
 Solving:  Stress period:    20    Time step:     1    Groundwater Flow Eqn.
 Solving:  Stress period:    21    Time step:     1    Groundwater Flow Eqn.
 Solving:  Stress period:    22    Time step:     1    Groundwater Flow Eqn.
 Solving:  Stress period:    23    Time step:     1    Groundwater Flow Eqn.
 Solving:  Stress period:    24    Time step:     1    Groundwater Flow Eqn.
 Solving:  Stress period:    25    Time step:     1    Groundwater Flow Eqn.
 Run end date and time (yyyy/mm/dd hh:mm:ss): 2023/05/04 16:05:11
 Elapsed run time:  0.374 Seconds

  Normal termination of simulation
Load head data from the output files:
[8]:
import numpy as np

hds = flopy.utils.HeadUFile(str(work_dir / f"{root_name}.hds"), model=gwf)
times = hds.get_times()
head = np.array(hds.get_data())
print(head.shape)
(3, 1499)
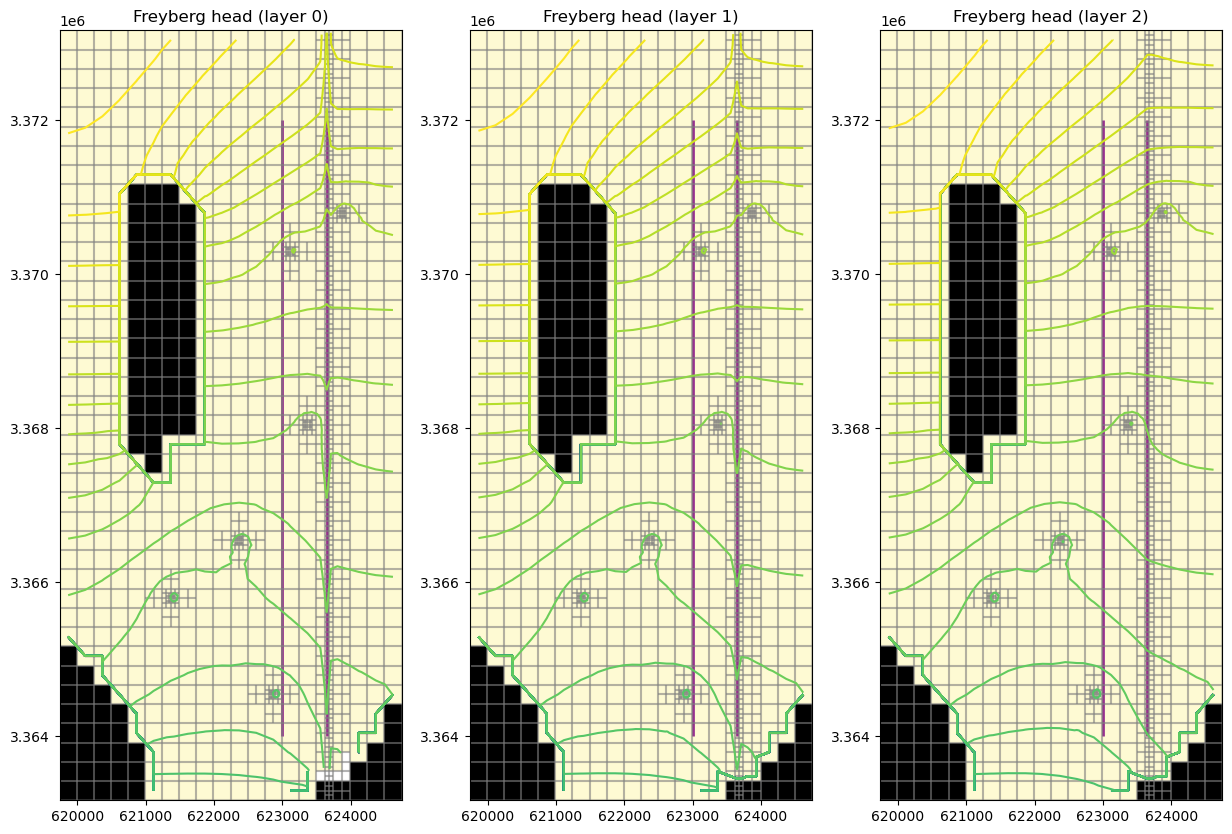
Plot the head colormap and contours for each layer.
[9]:
levels = np.arange(30, 35.4, 0.1)
fig = plt.figure(figsize=(15, 10))

for layer, h in enumerate(head):
    ax = fig.add_subplot(1, len(head), layer + 1)
    ax.set_title(f"Freyberg head (layer {layer})")
    pmv = flopy.plot.PlotMapView(modelgrid=mfgrid, ax=ax)
    mesh = pmv.plot_array(h, alpha=0.2)
    grid = pmv.plot_grid(alpha=0.2)
    shps = pmv.plot_shapes(lines, edgecolor="purple", lw=2, alpha=0.8)
    inac = pmv.plot_inactive(ibound=ibound)
    ctrs = pmv.contour_array(h, levels=levels)
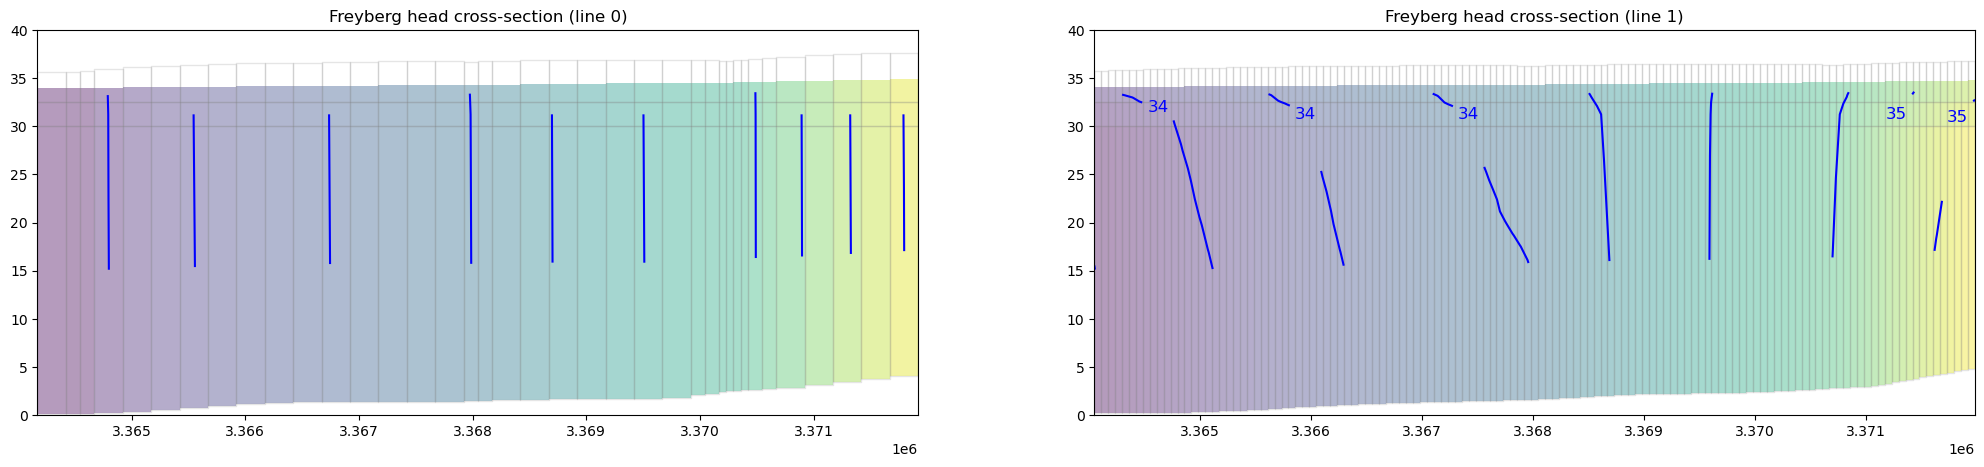
A head argument can be provided to CrossSectionPlot.contour_array() to show the phreatic surface.
[10]:
fig = plt.figure(figsize=(25, 5))

for i, line in enumerate(lines):
    ax = fig.add_subplot(1, len(lines), i + 1)
    ax.set_title(f"Freyberg head cross-section (line {i})")
    xsect = flopy.plot.PlotCrossSection(
        modelgrid=mfgrid,
        ax=ax,
        line={"line": lines[i]},
        geographic_coords=True,
    )
    xsect.plot_array(head, head=head, alpha=0.4)
    xsect.plot_ibound(ibound=ibound, head=head)
    xsect.plot_inactive(ibound=ibound)
    contours = xsect.contour_array(
        head,
        masked_values=[999.0],
        head=head,
        levels=levels,
        alpha=1.0,
        colors="blue",
    )
    plt.clabel(contours, fmt="%.0f", colors="blue", fontsize=12)
    xsect.plot_grid(alpha=0.2)
    ax.set_ylim([0, 40])  # set y axis range to ignore low elevations
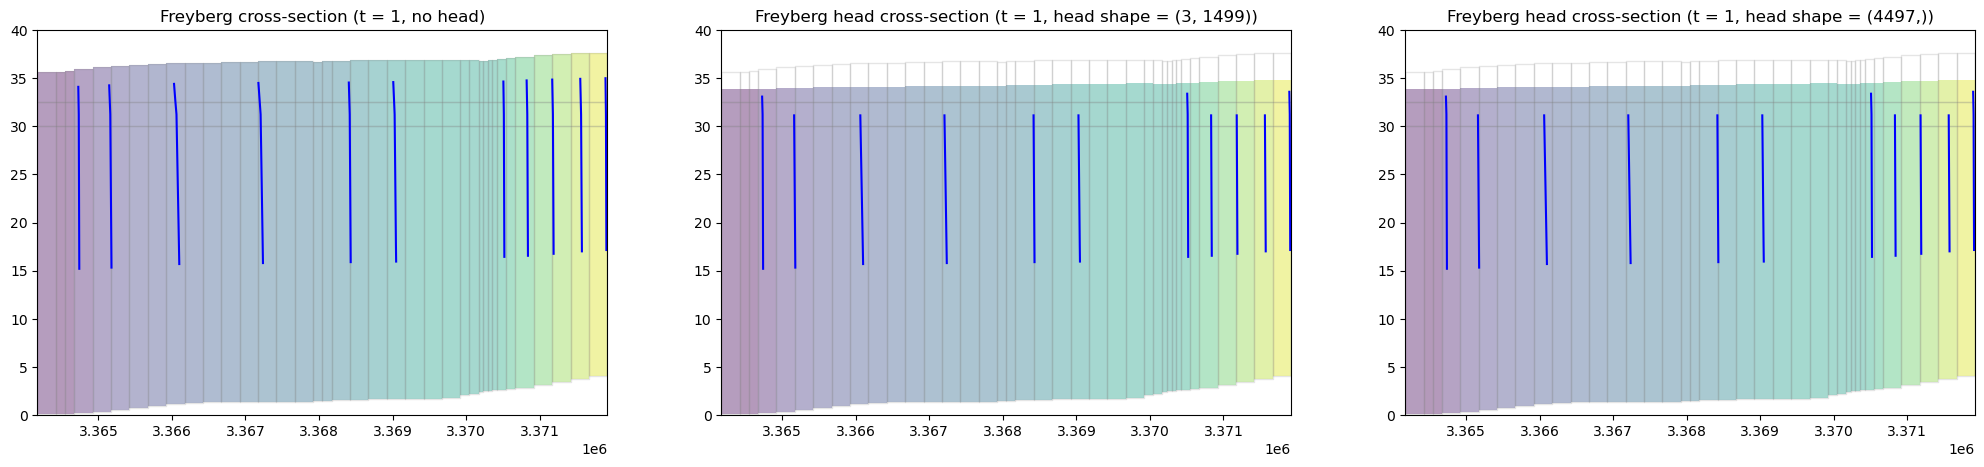
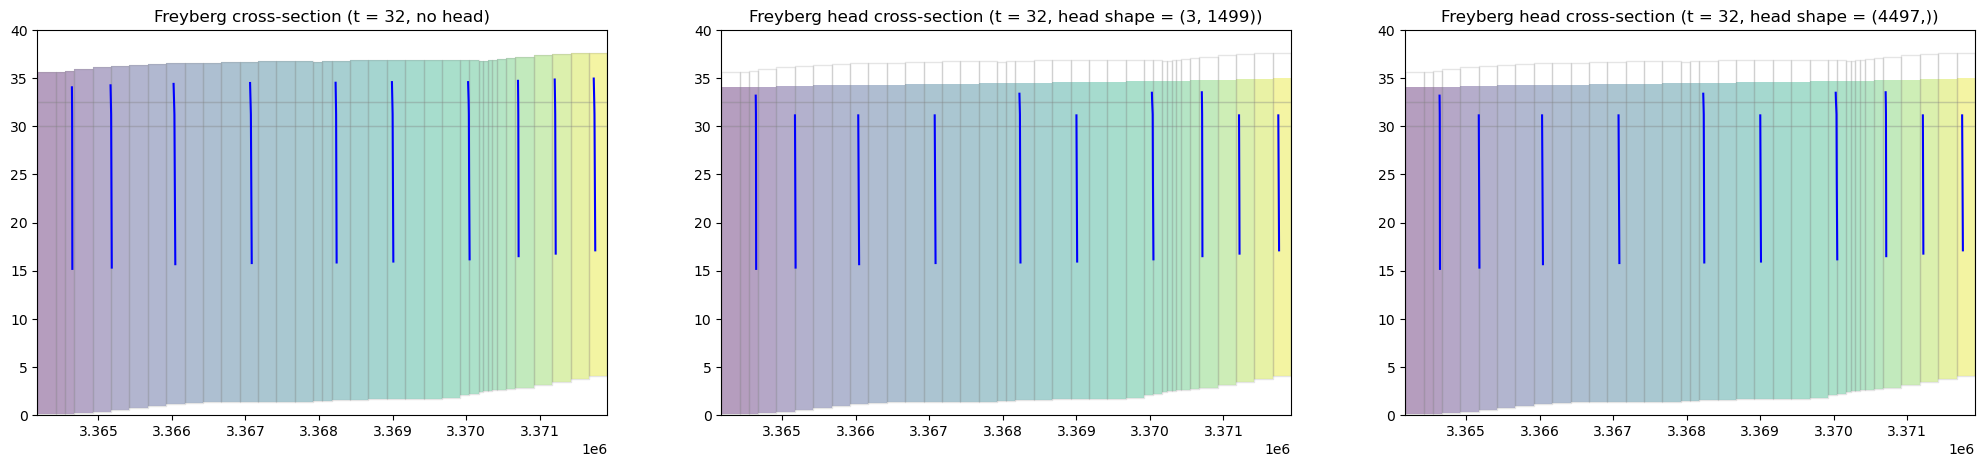
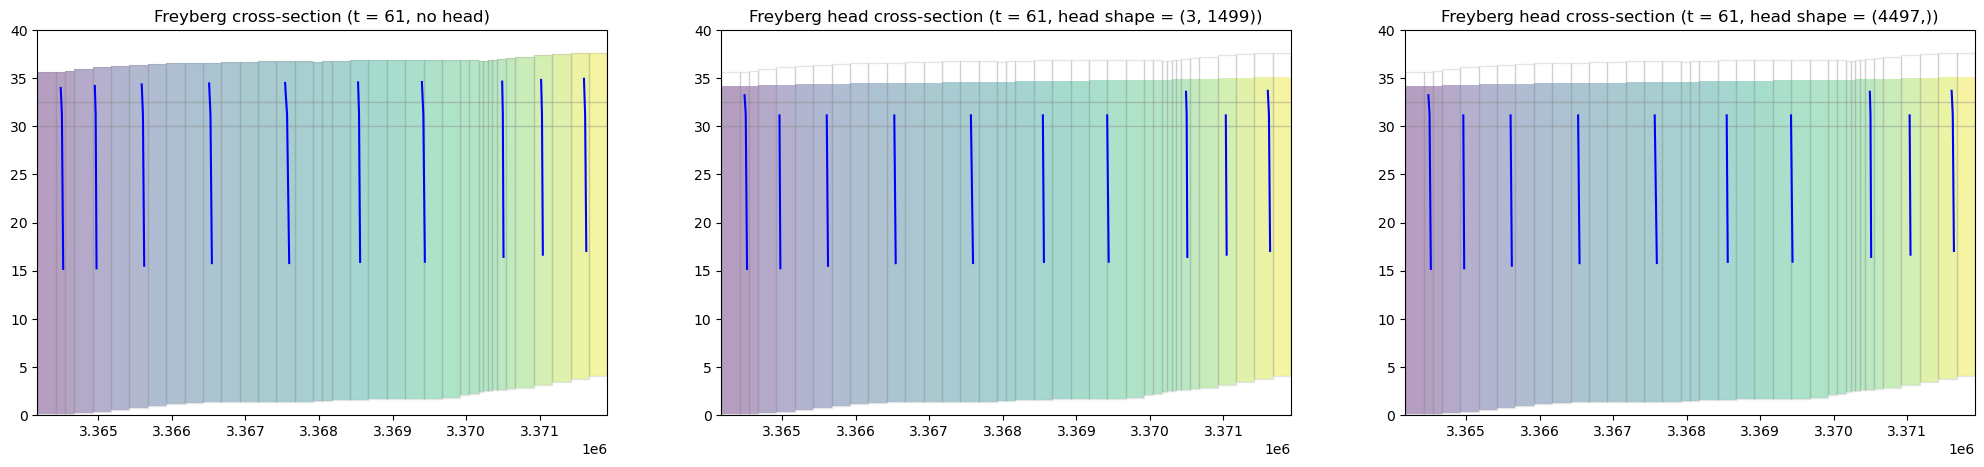
The head argument can be a 1D array or a 2D array matching the shape of the grid (i.e., head.shape == (layer count, ncpl)).
[11]:
line = lines[0]

for time in times[0:3]:
    head = np.array(hds.get_data(totim=time))
    head2 = np.hstack(head)

    fig = plt.figure(figsize=(25, 5))
    ax = fig.add_subplot(1, 3, 1)
    ax.set_title(f"Freyberg cross-section (t = {int(time)}, no head)")
    xsect = flopy.plot.PlotCrossSection(
        modelgrid=mfgrid, ax=ax, line={"line": line}, geographic_coords=True
    )
    cmap = xsect.plot_array(
        head2,
        masked_values=[-999.99],
        alpha=0.4,
    )
    contours = xsect.contour_array(
        head2, levels=levels, alpha=1.0, colors="blue"
    )
    xsect.plot_inactive(ibound=ibound, color_noflow=(0.8, 0.8, 0.8))
    xsect.plot_grid(alpha=0.2)
    ax.set_ylim([0, 40])  # set y axis range to ignore low elevations

    ax = fig.add_subplot(1, 3, 2)
    ax.set_title(
        f"Freyberg head cross-section (t = {int(time)}, head shape = {head.shape})"
    )
    xsect = flopy.plot.PlotCrossSection(
        modelgrid=mfgrid, ax=ax, line={"line": line}, geographic_coords=True
    )
    cmap = xsect.plot_array(
        head,
        masked_values=[-999.99],
        head=head,
        alpha=0.4,
    )
    contours = xsect.contour_array(
        head, head=head, levels=levels, alpha=1.0, colors="blue"
    )
    xsect.plot_inactive(ibound=ibound, color_noflow=(0.8, 0.8, 0.8))
    xsect.plot_grid(alpha=0.2)
    ax.set_ylim([0, 40])

    ax = fig.add_subplot(1, 3, 3)
    ax.set_title(
        f"Freyberg head cross-section (t = {int(time)}, head shape = {head2.shape})"
    )
    xsect = flopy.plot.PlotCrossSection(
        modelgrid=mfgrid, ax=ax, line={"line": line}, geographic_coords=True
    )
    cmap = xsect.plot_array(
        head2,
        masked_values=[-999.99],
        head=head2,
        alpha=0.4,
    )
    contours = xsect.contour_array(
        head2, head=head2, levels=levels, alpha=1.0, colors="blue"
    )
    xsect.plot_inactive(ibound=ibound, color_noflow=(0.8, 0.8, 0.8))
    xsect.plot_grid(alpha=0.2)
    ax.set_ylim([0, 40])
[12]:
try:
    # ignore PermissionError on Windows
    temp_dir.cleanup()
except:
    pass